

Array Studio User Guide
Version 4.0
10/31/2010
Omicsoft Corporation
Contents
View customization (from
task or legend)
Selection (click, drag or
lasso)
Single Variable
Classification
Quantitative Trait (SNP
Effect)
Quantitative Trait
(SNP*Treatment)
Next Generation Sequencing (NGS)
Map Fusion Reads (Single
End Illumina)
Report Fusion Genes
(Paired End)
Generate Transcript Level
Data
Run R Script (Microarray
Data)
MicroArray/MicroArray
Integration
Segment/MicroArray
Integration
Summarize Duplex
MicroArray Data
Generate Affymetrix CEL
Report
Generate Affymetrix MAS5
Report (3' IVT Arrays)
Two Chip Analysis (3' IVT
Probe Level)
Generate Custom Affymetrix
CDF Library
Generate Custom
Affymetrix SNP CDF Library
Pipeline - Batch Process
CEL Files
Pipeline - Export
Inference Reports
Generate Expression
Annotation
Generate Methylation
Annotation
Sample Size and Power -
Two Samples
Sample Size and Power - K
Samples
Build Custom Affymetrix
Annotation
Introduction
What is Array Studio?
Array Studio is a software package which provides state of the art statistics and visualization for the analysis of high dimensional quantification data (e.g. Microarray or Taqman data) and genotype data (e.g. SNP data, Copy Number data). It provides the fastest, easiest, and most powerful solution for -omic data analysis on the market. More than 400 features have been implemented based on feedback provided by industrial and academic users.
Features
·
Array Studio includes over 40 unique
customizable views, all of which are fully interactive (e.g. selection, zoom,
hot track, etc.) and highly customizable (e.g. change axis, colors, shapes,
etc.). Most of these views also have trellis support. All the views can be exported
as PowerPoint slides or Acrobat PDFs by a single mouse click. The graphs are
editable in PowerPoint.
· More than 50 analytical modules were designed for ease of use so that biologists can function at near the level of informatics specialists. The high dimensional linear modeling module provides the complete statistical analysis for multiple ANOVA, ANCOVA, repeated measure, split plot and a variety of other experimental designs. Non-negative matrix factorization and spectral map analysis are two of the many data exploration modules in the software. Data mining modules provide comprehensive support for classification (e.g. SVM and KNN) and regression (e.g. LASSO and Neural Network), with built-in variable selection and honest cross validation. Takes seconds or minutes instead of hours to do an analysis on a regular laptop computer!
· Array Studio also provides comprehensive support for project management, data manipulation, quality control, pathway analysis, gene ontology analysis, and power analysis. For industrial users, an internal audit trail and scripting are useful for data integration and customized analysis pipeline.
· Array Studio integrates with Array Server, Omicsoft’s solution for MicroArray/CNV/SNP data storage, search and integration. Easily retrieve projects from Array Server, and/or publish back to the server for storage and searching purposes.
Benefits
- Fastest data analysis and visualization on the market
- General linear model benchmarked with SAS®
- Automatic project management
- Automatic annotation support
- Automatic script generation
- One-Click exporting to Excel of tables and results
- One-Click exporting to PowerPoint of all visualizations
- One-Click downloading of data from the Gene Expression Omnibus(GEO) website, including the ability to automatically parse both design (sample information) and annotation, so that the project is immediately in the correct form for further analysis and visualization.
- VariableView, for looking at expression values on a per-gene basis
- General Linear Model for performing complicated analysis, including the ability to analyze mixed models, continuous and class covariates, nested factors, etc
- Quality Control Modules, including generating Correlation Heatmaps, Kernel density views, Principal Component Analysis, and others.
- Stunning performance—Most modules in Array Studio take seconds, not minutes to run. Array Studio has been shown to handle 20,000 samples and millions of rows on an average laptop computer. A top-tier workstation is not necessary to run Array Studio effectively.
- Incredible GenomeView and RegionView for visualizing CNV segmentation results.
- Ability to easily import 1000s of microarray, SNP, or CNV chips on a regular computer
- Fast and powerful segmentation algorithm for Copy Number analysis. GenomeView allows easy editing of copy number segments, as well as visualization of segments in relationship to Log2Ratio and AlleleDifference (B Allele Frequency)
- The Taqman Import and Normalization wizard is industry leading. The module was designed for use by top statisticians and bioinformaticians at a leading pharmaceutical company, and includes the ability to import directly from ABI Result Text files, normalize the data using a number of statistical methods, and eventually visualize the results using the same visualizations used elsewhere in Array Studio.
- Comprehensive statistical support for SNP, Genotyping, and Copy Number analysis, including the analysis of basic association studies, quantitative traits, categorical traits, survival trait analysis, repeated measure traits, Linkage disequilibrium analysis, Dose data association, probability association analysis, and more.
- Automatic annotation support and built-in annotation browser-For most leading microarray and genetic products, Array Studio automatically downloads gene annotation and links it to every dataset and result created by the user. Web Details on Demand allows the user to quickly link to public resources that relate to selected probesets or markers in a dataset
- Integration with GeneGo's MetaCore 5.3™ Pathway Analysis Tools, for microarray, SNP, and CNV data. Easy export of data for users of MetaCore#0153, as well as on-demand information about a particular probeset or SNP ID.
- Integration with Ingenuity Pathways Analysis. Easy export of data for users of IPA, as well as on-demand information about a particular probeset or gene.
- Single deployment with automatic update support ensures that the user will always be running the latest version. With Omicsoft’s commitment to implementing reasonable user requests, this allows the user to always have the newest software, including any and all modules released since the user purchased the software.
Who Should use Array Studio
Array Studio is designed for bioinformaticians and biologists for analysis of microarray, SNP, Copy Number Variation (CNV), and Next Gen Sequencing (NGS) data. For the bioinformatician, Array Studio should provide a full workflow for importing and normalization of data, quality control, analysis (full statistical models), and clustering and pattern analysis. For the biologist, Array Studio can provide a powerful way to easily visualize their data, as well as providing workflows for suggested analysis, for those not familiar with the intricacies of data analysis. Array Studio supports all popular microarray, SNP/Genotype, Exon/gene arrays, CNV/CGH, RT-PCR and Next Generation Sequencing platforms.
Getting Started
Requirements
Array Studio requires Microsoft .NET 2.0 framework. As a result, most versions of Array Studio require that the user have administrative privileges to install .NET 2.0 Framework, or the ability to do so before installing Array Studio. By default, the installation page for Array Studio will automatically install .NET 2.0 Framework if the user does not have this installed previously.
While Array Studio does not have any specific requirements for memory or processor speed, it is recommended that the user have at least 1gb of RAM for microarray analysis, and at least 2gb of RAM for ExonArray, SNP/Genotyping, and CNV analysis.
For microarray analysis, hard drive space is not an issue, however the user should ensure that they have sufficient hard drive space for larger ExonArray, SNP/Genotyping, and CNV analysis. Extremely large datasets, such as Dose or Probability SNP data, utilize a large amount of hard drive space. The user should ensure that there is sufficient space on the hard drive for such analyses.
For NGS analysis in 64-bit mode 8 GB of RAM is recommended, for 32-bit mode 2 GB of RAM
is recommended. For hard
drive space, both your
Omicsoft temp folder and the data for the analysis must reside on a hard drive
that has 3-times the amount of free space as the size of the raw data files.
The Omicsoft software home directory is typically located in the user's My Documents folder, under the Omicsoft folder. This folder contains all of the user's annotations, favorites, Ontology, Refseq, Ensembl, Hapmap data, and more. In addition, this folder is used as the temporary working directory. If the user is concerned about space on the hard drive containing this folder, it can be changed by going to the Tools menu | Preferences | Advanced | Omicsoft home directory.
Installing Array Studio
Multiple methods are available to install Array Studio. The user should choose the method that best suits them depending on their particular computing environment. The installation options are as follows:
ClickOnce (Recommended)
If you will be running Array Studio from an internet-connected computer and would like to always be running the latest version you may use ClickOnce to access the latest online version of Array Studio. Most corporate and academic users are advised to choose this option. Every time you open Array Studio on your computer, it will connect to the internet and ensure that you are running the latest version. The Microsoft .NET 2.0 Framework will be installed if not previously installed on your computer. Use the following URL to launch the online version of Array Studio: http://www.omicsoft.com/publishstudio.php
Note: You must be running Internet Explorer version 6 or 7, or Firefox with the FFClickOnce plugin. If using Firefox, make sure to click Run ClickOnce application and not Save File.
The Firefox FFClickOnce plugin can be installed from the following URL:
https://addons.mozilla.org/en-US/firefox/addon/1608/
Offline Mode
If you plan to run Array Studio in offline mode and are not concerned about always having the latest version you should download the Array Studio Windows installer. This version will install a program that can be uninstalled via the standard windows control panel, however you are not guaranteed to always be running the latest version of Array Studio. The .NET 2.0 Framework will be installed if not previously installed on your computer. The Array Studio Windows installer can be downloaded from the following URL:
http://www.omicsoft.com/software/ArrayStudio/ArrayStudioInstaller.msi
Closed Environment Mode
If you are working in a closed corporate environment you should download our standalone .exe file, which can be used to run Array Studio. The hardware requirements for this version of Array Studio are listed in the "Requirements" section of this guide. The stand-alone .exe file can be accessed from the following URL:
http://www.omicsoft.com/software/ArrayStudio/ArrayStudio.exe
Note: This version is updated infrequently, and should only be
used if the user has no access rights to install software.
Learning to Use Array Studio
Omicsoft believes that besides providing the
best products, it is important to provide the best support as well. From
our rapidly expanding knowledge base to the ability to easily get one-on-one
personal web meetings, Omicsoft aims to provide the user with a top support
experience.
Documentation
Tutorials
The Omicsoft website offers tutorials for the various Array Studio modules including SNP Data Analysis, Affymetrix Data Analysis, CNV Analysis, ExonArray Data Analysis and a Taqman demonstration. These tutorials are a great beginning guide to using Array Studio. They Include links to download sample datasets, along with step-by-step directions for carrying out the various analysis methods.
Knowledgebase
The Omicsoft knowledge base is a user-friendly information
center. Our support team keeps the Knowledge Base up-to-date with common and
complex questions that we receive from our customers. If you need a place to
start when you have questions or for troubleshooting, you can start searching
here with a term of interest or you can browse by pre-defined categories. The Knowledge Base can be accessed by selecting the
"Help Center" tab at the top of the Array Studio page:
Help Documents
Context sensitive help documents are available throughout Array Studio and can be accessed by simply using a right-mouse-click on any given menu or sub-menu item or selecting the "Help" button on a pop-up window.

White Papers
White Papers are available for the various models, analysis and specifications used in Array Studio. These White Papers can be accessed from "Resources" section or at the Omicsoft website URL: http://www.omicsoft.com/whitepapers.php
Support
Contact Customer Support
Our regular support hours are Monday through Friday 9:00
AM through 5:00 PM Eastern Time. Emailed technical support requests are responded
to on the same business day, and in most cases within a few hours.
Email: support@omicsoft.com
Phone: 1-888-259-OMIC (1-888-259-6642) Option
1
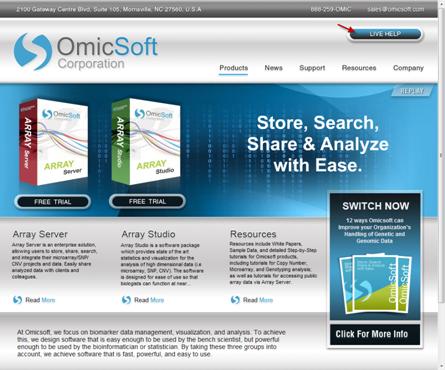
Live Help
A "Live Help" option is available from the Omicsoft webpage. Selecting this "Live Help" button will open a "Webex Live Support" window. Here you can enter your contact information and Array Studio question which will then be sent to a monitored support queue. An Omicsoft support person will respond as they become available.
Personal Web Meeting
You can make a request to see a live demonstration of an
Omicsoft product (usually 1 hr is required). These one-on-one meetings are
conducted using the telephone or VOiP and your favorite web browser. This
format enables us to turn the presentation over to you so you can show us what
is happening on your computer screen (with your permission of course). This
allows us to safely guide you through analyses on your own data sets without
having to exchange any data or files.
Array Studio Interface
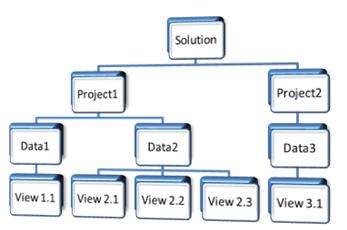
Data Organization
Data in Array Studio is arranged in an hierarchal fashion.
Solution can be thought of as the current session as the software is being used.
The solution is the placeholder where new or existing projects are added. Multiple
projects can be opened in a given Solution.

The Solution is the highest level within the data
organization hierarchy in Array Studio.
You can open multiple projects in the solution
Each project can contain multiple datasets
You can easily organize your data and lists by folders
You can rename any data/view/folder
A lot of context sensitive functions by right clicking
Commonly used right-click functions
Add view
Import design
Import annotation
New folder
Copy/paste views
Export
View audit trail
View source
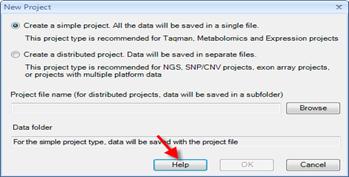
Project
Distributed project
save all data/lists in a folder (recommended for Exon Array/SNP/CNV)
Simple project
save all data/lists in a single file (recommended for MicroArray/Taqman)
-Omic data
Design
Data folder
Table data
Views
List folder
Lists
User Interface
The Array Studio interface is designed with a combination of tabs, windows and menus for navigating and accessing the various sections and functions of the software.
The tabs across the top of the workspace include Local Analysis (Array Studio), Server Explorer (Array Server) and Help Center.

Upon selecting the "Local Analysis" tab, the Array Studio workspace is displayed. This workspace is comprised of four distinct windows as indicated below (Workflow/Solution Explorer, Data viewer, Details window, View controller). These windows can be independently opened/closed or moved within the workspace.
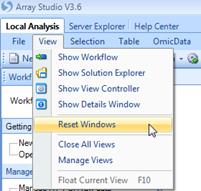
The workspace windows can also be controlled from the View menu. Selecting the View
| Reset Windows option will reset the Array Studio workspace to the default
window layout.
Workflow/Solution Explorer
The Workflow/Solution Explorer Window should be visible on the left side of the screen. If this window is not visible, go to the View Menu | Show Workflow. The Workflow Window should appear similar to the screen shot here.
Workflow
The Workflow Window should be visible on the left side of the screen. If the Workflow Window is not visible, go to the View Menu | Show Workflow. The Workflow Window should appear similar to the screen shot here.
The Workflow Window is especially useful for new users. It provides a “guide” for running different types of analysis. Clicking the Workflow dropdown box displays five different workflow options (Microarray, ExonArray, RT-PCR, Genotyping and CNV).
Notice that the Microarray Workflow is separated into different sub-sections: Getting started, Manage data, Preprocess, Quality control, Statistical inference, and Pattern recognition. These options will vary depending on which workflow is selected.
While it is possible to access all of these functions via the menu commands in Array Studio, the Workflows are designed to make it easier for the new users to work through their data in a stepwise fashion.
Solution Explorer
The Solution explorer can be accessed by selecting the bottom tab if viewing the Workflow Window. If this window is not visible, go to the View Menu | Show Solution Explorer. The Solution Explorer Window should appear similar to the screen shot here.
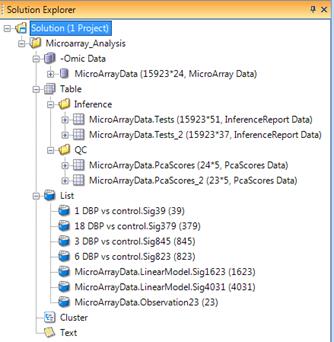
You can open multiple projects in the solution. Each project can contain multiple datasets. You can easily organize your data and lists by folders
You can rename any data/view/folder
Many context sensitive functions are available by right mouse button clicking. Examples include:
· Add view
· Import design
· Import annotation
· New folder
· Copy/paste views
· Export
· View audit trail
· View source
Data Viewer
Views are different from graphs
They are fully interactive and customizable
The status is stored by projects
You can open/close views any time
Most views can be saved as PDF/EMF/PowerPoint/Excel
Based on tabs, but you can float any view
Drag the tabs to split the viewer
F10 to float tabs
Mouse over to show the project name and data name
Your active view (not active project) will determine the default selected data
Details Window
Details window show the details for selected variables or observations (depending on the context)
View Controller
Always use view controller to customize your view
Task tab: view sensitive menus to customize your view
Variable tab: filter the variables (-omic data)
Observation tab: filter the observations (-omic data)
Filter tab: filter the observations (table data)
Legend: show legend information
Filter status
and customized filters are saved with projects, and the filters might be
inherited when generating new data!
View customization (from task or legend)
Exporting
Concepts/Conventions
Data Structure
High dimensional data structure (L shape structure)
· Y is the measurement. There can be millions of rows and thousands of columns in Y
· X is key for statistics and visualization
· A is key for bioinformatics and visualization
Data Types Supported by Omicsoft
|
Data type |
Variable type |
Cell value type |
|
Expression data or expression-like data |
Transcript, probeset,
protein, Compound, etc. |
Continuous value
(abundance) |
|
ExonArray data |
Exon |
Continuous value
(abundance) |
|
CNV data |
CNV marker |
Continuous value (abundance
or ratio) |
|
ChIP-chip data |
Site |
Continuous value
(abundance) |
|
Methylation |
Site |
Continuous value
(abundance) |
|
SNP data |
SNP marker |
SNP genotype |
|
Genotype type |
Mutli-allelic marker |
Genotype |
|
Mutation data |
Site |
Frequency vector |
|
SNP dose data |
SNP marker |
Continuous value |
|
SNP probability data |
SNP marker |
Genotype frequency vector |
|
NGS data |
??? |
??? |
Filtering
Selection (click, drag or lasso)
Hot track
Broadcasting
Microarray
Preprocess
Filter
Normalize
Impute
Transform
Combine
Summarize
Summary Statistics
Pairwise Correlation
Missing Pattern
Kernel Density
kernel density estimation (or Parzen window method) is a non-parametric way of estimating the probability density function of a random variable. As an illustration, given some data about a sample of a population, kernel density estimation makes it possible to extrapolate the data to the entire population.